AI Calorie Tracking Accuracy Drops 30% on High-Fat Meals
AI calorie tracking accuracy can drop by 30 percent on high-fat meals. Learn how this compounding undercount sabotages your deficit and how to fix it.
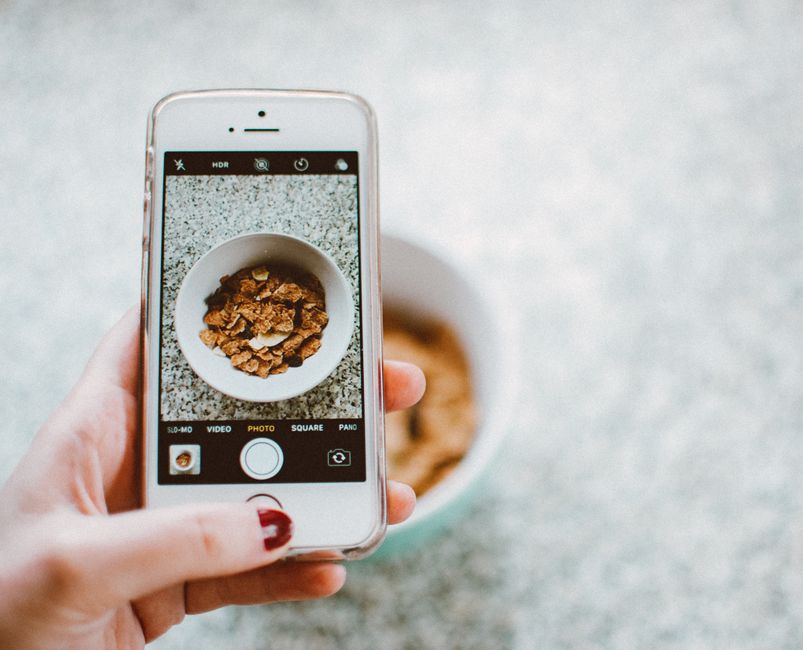
You snap a photo of your keto bowl, the app returns a number, and you log it. The figure looks reasonable. It is also wrong by about a third, and the error bends in one direction: your real intake runs higher than the app reports. For anyone relying on AI calorie tracking accuracy to manage a strict deficit, a ketogenic cut, or a precision reverse diet, that silent gap is the difference between a protocol that works and one that mysteriously stalls.
Stay in the loop.
Get the latest posts and exclusive content delivered to your inbox.
Join 10 readers. No spam. Unsubscribe in one click, anytime.
The Systematic Flaw in AI Calorie Tracking Accuracy
When researchers recently tested four popular AI-powered food apps against carefully prepared reference meals, every one underestimated calories and fat by about a third, or roughly 30 percent. Carbohydrates were tracked more consistently, but high-fat ketogenic dishes produced the worst breakdowns. That smartphone calorie app study reported something more troubling than general inaccuracy: all four apps erred in the same direction, underestimating intake by roughly 30%. The bias appears category-wide rather than app-specific, so switching tools is unlikely to fix the problem.
Random noise would be tolerable. If an app overestimated a salad by 100 calories and underestimated a steak by 100, the errors would cancel across a week of varied meals. Directional bias does not cancel. It accumulates. Each time you photo-log a fatty meal, the app shaves calories off your daily total in the same direction, day after day, until the gap between logged intake and actual intake becomes a structural feature of your data rather than a rounding error.
This distinction matters most for metabolic health tracking, where AI calorie tracking accuracy directly determines whether a deficit or surplus actually exists. Research on AI image-based food estimation has shown that automated systems struggle with the exact foods precision dieters prioritize: energy-dense, high-fat items where a small visual difference represents a large caloric gap. When a model cannot tell whether a swipe of almond butter is thin or thick, it defaults to a portion assumption that trends smaller than what is actually on the plate.
Why High-Fat and Keto Meals Break the Algorithms
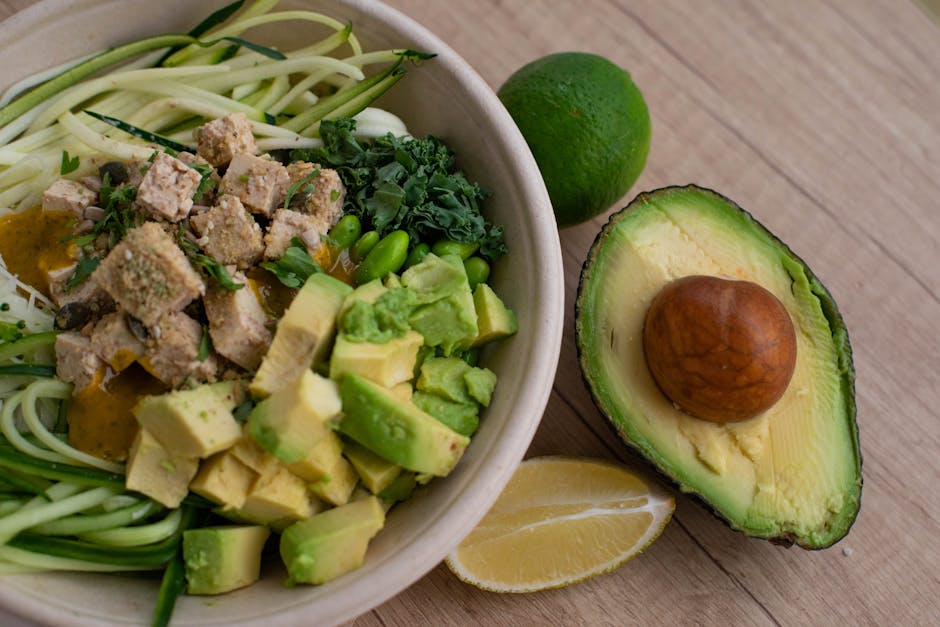
Two variables drive the damage: caloric density and visual occlusion. Both strike hardest at the foods that dominate ketogenic and metabolic-health protocols.
Caloric density breaks portion inference
Computer vision models classify what is on the plate, estimate volume, then multiply by a caloric density value. The first two steps work reasonably well for bulky, low-calorie foods. A pile of broccoli is large in volume and small in calories, so even a 20% volume error translates to a trivial calorie miss. The inverse destroys the model. A tablespoon of olive oil, roughly 120 calories, occupies the same visual footprint as a tablespoon of water. Research on portion size estimation errors shows that vision-based systems consistently underestimate the mass of compact, energy-dense components, because the spatial signal is too weak relative to the caloric payload.
The math compounds quickly. If a model underestimates the olive oil on your salad by half a tablespoon, it misses 60 calories from a single ingredient. Stack three or four dense components on the same plate (avocado, cheese, nuts, oil) and the combined miss easily exceeds 300 calories from a meal the app reports as clean and on-target.
Visual occlusion hides the fuel
The second failure mode is structural. AI sees what the camera sees, and the camera sees the top layer. Research on visual occlusion in mixed bowls reports that layered or buried ingredients are systematically undercounted in automated estimates. Dressing pools at the bottom of a salad bowl. Butter melts into cauliflower. Oil disappears into the surface of a roasted vegetable. The fat is there and the calories are there, but the pixel data gives the model almost nothing to measure.
Caloric density estimation errors in deep learning models compound the occlusion problem. When the system cannot see the fat and cannot infer its quantity from visible volume, it falls back to training-set averages that underrepresent how generously a real cook applies oil, butter, and cheese. The mechanism explains why AI apps underestimate fat in particular: invisible inputs produce invisible calories, and the models currently lack a reliable correction mechanism for the gap.
The Compounding Math of a Daily Undercount
The danger is not the arithmetic. It is the psychology. Precision dieters trust consistency above almost everything else, and AI photo-loggers deliver consistency in spades. Log the same bowl twice and the numbers match to within a few calories. That repeatability reads as reliability. It is not. A tool can be precisely wrong every single time and still feel trustworthy, because the output is stable, clean, and internally consistent. This is the core trap: the app is precise without being accurate, and for someone who logs every gram, precision without accuracy is the most dangerous kind of measurement error.
Directional bias is uniquely insidious because it produces data that looks like evidence. When the log says 2,000 calories and the scale refuses to move, the data-driven mind reaches for the most sophisticated explanation first. Metabolic adaptation. Thyroid downregulation. Cortisol-driven water retention. It blames the engine, not the dashboard. Genuine metabolic plateaus are real, and the physiology of weight loss plateaus is well documented, but a photo-logger that undercounts high-fat meals by a third manufactures a false plateau that feels identical to a real one from the inside.
The math behind the gaslighting
The study reports a proportional gap, not a fixed calorie number. Apps underestimate high-fat meals by about one-third. Suppose you log 2,000 calories and roughly half come from high-fat meals, keto bowls, oil-dressed salads, butter-basted proteins. The one-third underestimate means the actual value of those 1,000 logged calories is closer to 1,500, because 1,000 is two-thirds of 1,500. The other 1,000 logged calories from leaner foods track roughly accurately. Your true intake: about 2,500. The daily blind spot: approximately 500 calories, and every figure below derives from that transparent scenario, not from the study.
What a 500-calorie miss does to a cut
Your maintenance is 2,500 calories and you target a 500-calorie daily deficit for a steady one pound per week of fat loss, using the standard 3,500-calories-per-pound approximation. You log diligently, hit your 2,000-calorie target in the app, and trust the data. But the one-third underestimate on your high-fat meals inflates your actual intake to roughly 2,500. Your real deficit is zero. You are eating at maintenance while your log says you are in a meaningful cut.
The dieter who misdiagnoses this stall as metabolic adaptation does not question the logger. They cut calories further, add refeed days, cycle carbohydrates, or blame stress and sleep. None of it works, because the leak is not in the metabolism. It is in the data. The log is airtight and the scale is stuck, and that contradiction is unbearable precisely because the numbers look so clean.
The weekly and monthly blind spot
A 500-calorie daily miss compounds into a 3,500-calorie weekly blind spot, approximately one pound of unaccounted body fat per week. Across a 30-day month, it approaches 15,000 calories, more than four pounds of fat that your food log says does not exist. This is how a disciplined dieter can log every meal, never cheat, and still watch the mirror refuse to change.
The reverse diet trap
For reverse dieting, the damage runs the opposite direction. You add 50 to 100 calories per week, methodically hunting for maintenance. But if your baseline undercount is roughly 500 calories, you are already 5 to 10 weeks ahead of where the app says you are. You believe you have found maintenance when you have been in a quiet surplus the entire time, and the scale starts climbing for reasons your food log cannot explain.
Five Meal Archetypes That Trick AI Food Trackers
Total fat content does not predict tracking error. Meal structure does. The number of distinct, visually hidden fat layers in a dish predicts how badly AI underestimates it far more reliably than the fat gram total. A buttered steak carries heavy fat in a single visible source, so the model's inference error stays small. A keto bowl at the same total fat, built from avocado, oil, cheese, and nuts, triggers four separate inference failures, and each invisible layer compounds the gap independently.
Three structural rules separate meals the camera handles from meals that silently break it. Single-fat-source meals outperform multi-fat bowls because the model resolves one inference, not four. Flat plates beat stacked or layered bowls because the camera captures only the top layer and has no pixel data for what sits beneath. Emulsified oil in dressing is the worst offender because it is volumetrically invisible and calorically dominant, the exact combination where visual inference collapses. This is why keto diet macro tracking is uniquely exposed: a well-formulated ketogenic protocol concentrates 70 to 80% of daily calories in fat across more sources per meal than any other dietary pattern.
The table below reframes each archetype through the structural complexity lens.
| Meal archetype | Structural failure mode | Estimated calorie miss |
|---|---|---|
| Oil-dressed salads | Emulsified dressing pools at the bottom; volumetrically invisible, calorically dominant | 150 to 250 |
| Loaded keto bowls | Four-plus fat sources compressed into one mass; each hidden layer compounds independently | 200 to 400 |
| Butter-basted proteins | Single fat source melted into the surface; less complex but still invisible to the lens | 100 to 200 |
| Nut butter swipes | Thickness is unreadable from above; dense layer looks identical to a thin smear | 80 to 200 |
| Cheese-blanketed casseroles | Melted cheese occludes everything underneath; the camera sees only the top stratum | 150 to 300 |
The calorie ranges are illustrative, derived from the typical caloric payload of hidden fat components rather than direct measurement of any specific app. The consistent signal across all five is structural: every archetype fails because multiple fat layers are invisible to a pixel-based model, not because the total fat number is large.
The Hybrid Protocol for Accurate Macro Tracking

The protocol has one rule. If fat contributes more than 30% of an ingredient's calories, you weigh it on a digital scale and log it manually. Everything else gets the camera.
The 30% threshold in practice
The threshold exists because caloric density is the variable that breaks computer vision. Fat delivers 9 calories per gram, more than double the 4 calories per gram of protein or carbohydrate. Below the 30% line, a volume estimate stays within a tolerable error band because the calories are spread across enough visible mass. Above it, small visual misreads compound into large calorie misses. A comparison of AI apps versus digital scales shows that weighed entries outperform photo estimates by a wide margin on energy-dense foods, because the scale measures mass directly and eliminates the inference gap that plagues computer vision.
A worked example: the keto bowl
Build a 750-calorie keto bowl: mixed greens, grilled chicken, half an avocado, olive oil dressing, and shredded cheese.
AI-logged (camera): - Mixed greens: 40 calories - Grilled chicken breast, 6 oz: 280 calories
Scale-logged (manual): - Avocado, 80 g: 130 calories - Olive oil, 1.5 tbsp: 180 calories - Shredded cheese, 30 g: 120 calories
You photograph the greens and chicken, then weigh the three fat components individually. A photo-only estimate would likely undercount the avocado, oil, and cheese by 150 to 250 calories, because those are exactly the ingredients where volume inference fails. The scale closes that gap to zero.
The ROI of 60 to 90 seconds
Weighing the fat components takes 60 to 90 seconds per meal. For someone running a 500-calorie daily deficit, those seconds protect the entire deficit from collapsing to zero. Research on automated dietary assessment tools suggests the technology is improving, but until vision systems can measure invisible fats by photograph, manual logging remains the only method that preserves the integrity of a precision macro protocol. The time cost is a tax on accuracy, and for high-fat meals the return on that tax is a meal logged correctly rather than one that silently undercounts by a third.
Speed versus accuracy trade-off
A directional bias in food logging frames the trade-off clearly. Photo logging wins on speed, convenience, and long-term adherence. Manual logging wins on accuracy, especially for high-fat meals where the error is largest. The hybrid approach captures both. You keep the convenience of AI for the components where it performs reliably, and you deploy the scale where silent underestimation would compound into a weekly metabolic blind spot.
For biohackers and precision dieters, the protocol is straightforward. Use AI as a first-pass estimator for simple, low-fat foods, but treat every high-fat component as a manual logging event. That daily undercount closes the moment the scale replaces the camera for the foods that matter most.
Key Takeaways
If your deficit log looks clean but the scale will not move, suspect the logger before the metabolism. Run this three-step diagnostic:
- Audit the last week. Re-weigh one high-fat meal you photo-logged and compare the real total against the app's estimate. The gap is your directional undercount.
- Apply the 30% fat threshold. If fat contributes more than 30% of an ingredient's calories, weigh it manually. Reserve the camera for vegetables and lean protein.
- Run a 7-day fat audit. Weigh every oil, butter, cheese, and nut component for one week, then compare against your photo estimates to quantify your personal error gap.
Stay in the loop.
Get the latest posts and exclusive content delivered to your inbox.
Join 10 readers. No spam. Unsubscribe in one click, anytime.
About the author
Jordan Reyes
Registered Dietitian
Jordan ditched diet dogma for metabolic health, running continuous glucose monitors and food journals to see what actually moves the needle. He writes nutrition and supplement protocols grounded in evidence, not influencer trends.
Related Posts

Artificial Sweeteners Gut Bacteria Risks Across 39 Types
Artificial sweeteners gut bacteria research shows 39 sweeteners act differently when combined with caffeine and medications. Find your safest options.
4 to 6 Whole Grain Servings Per Day, Dosed in Grams
Whole grain servings per day, translated into grams. Turn the 4 to 6 servings from 87 trials into a protein-first heart health protocol you can weigh.

Build a Hydration Protocol From Your Sweat Rate
Your hydration protocol starts with a 30-minute sweat rate test, then dose fluid and sodium for heavy training, sauna sessions, and low-carb cutting.