Your Comprehensive Blood Panel Misses More Than You Think
A comprehensive blood panel covers chemistry well but misses structure, function, and trajectory. Here is what blood work cannot see and how to test for it.
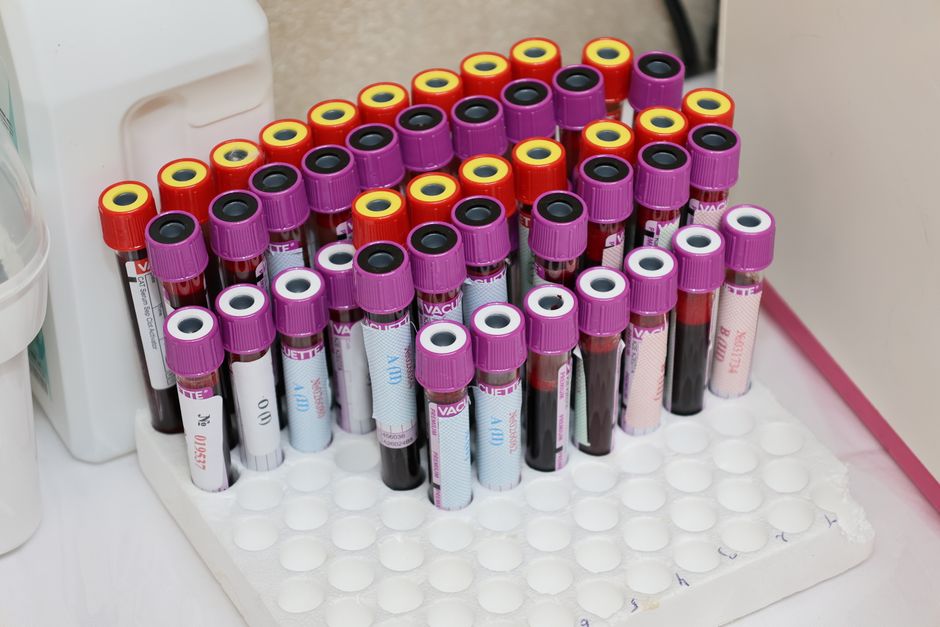
The satisfying version of health surveillance looks like this: a comprehensive blood panel with a hundred markers, every result flagged green, a PDF filed away as proof of diligence. Peter Attia has a number for what that PDF is actually worth. On his podcast he has put it at "somewhere between 25 to 30ish percent" of the complete information he would want to build and manage a patient's risk picture.
Stay in the loop.
Get the latest posts and exclusive content delivered to your inbox.
Join 50 readers. No spam. Unsubscribe in one click, anytime.
Treat that number as an audit finding rather than a measurement, and it survives inspection surprisingly well. Blood work is the highest-value sensing channel in medicine. It is also a single instrument with a hard detection envelope: it reads plasma chemistry at one moment in time and grades it against population statistics. That makes it strong on metabolic, lipid, hepatic, renal, endocrine, and hematologic risk, and structurally blind to trajectory, personal baselines, and entire disease domains. Plaque structure, function under load, bone and muscle mass, clonal mutations, cognition, and most toxic exposures never show up in plasma at all.
The fix is not another forty markers bolted onto the order form. It is layering other kinds of sensing, ranked by information gained per decision changed. What follows is a disease-by-disease audit of Attia's blood work figure, a mechanism-level map of the blind spots, and a tiered fill-in protocol you can run on a calendar.
What a Comprehensive Blood Panel Actually Measures
Blood is the only tissue you can sample broadly, cheaply, and repeatably. Plasma drains every organ, so a few tubes capture a genuinely wide cross-section of physiology, which is why nothing else in medicine comes close on cost per data point.
| Domain | Representative markers | What it genuinely captures |
|---|---|---|
| Metabolic | fasting glucose, HbA1c, insulin, uric acid | glycemia over hours to months |
| Lipids and lipoproteins | apoB, LDL-C, triglycerides | circulating drivers of atherosclerosis |
| Hepatic | ALT, AST, GGT, bilirubin, albumin | liver injury and synthetic function |
| Renal | creatinine, eGFR, cystatin C | filtration capacity |
| Endocrine | TSH, free T4, testosterone | hormone axis status |
| Hematologic | CBC, ferritin, B12 | oxygen transport, immunity, iron stores |
| Inflammation | hsCRP | systemic inflammatory tone |
Two properties make this layer the anchor. First, repeatability: you can redraw monthly after a medication change, something no imaging modality permits. Second, computation: the same draw yields derived indices. FIB-4, calculated from age, AST, ALT, and platelet count, serves as a first-line noninvasive fibrosis screen in AASLD noninvasive liver guidance, and it costs nothing beyond the panel you already ordered.
Auditing the 25 to 30 Percent Estimate
No dataset computes this figure. It is one expert's estimate of how much actionable risk labs capture, and the honest way to audit blood test limitations is disease by disease.
Strong coverage. For type 2 diabetes and thyroid dysfunction, blood work approaches gold-standard territory. HbA1c averages roughly three months of glycemia, and TSH typically catches primary thyroid failure before symptoms do. Among chronic diseases, these two yield fully to plasma chemistry.
Partial coverage. Cardiovascular disease is the interesting case. An apoB measurement quantifies the principal causal driver of atherosclerosis, and lowering it changes outcomes. But that number describes the river, not the sediment. Two people with identical apoB values can carry very different plaque loads, because plaque reflects decades of exposure, blood pressure, genetics, and inflammation that a lipid panel indexes only crudely. Lipids measure a modifiable risk factor, not the disease state.
Minimal or no coverage. Early cancer rarely announces itself in routine chemistries, and the classic exceptions are contested. Neurodegeneration, osteoporosis, sarcopenia, aneurysms, and arrhythmias leave no trace in a standard panel. And the leading cause of death in younger adults, accidents and trauma, was never a lab question to begin with.
Verdict: 25 to 30 percent is directionally fair, arguably generous for cancer and harsh for metabolic disease. Used well, the figure is a forcing function. It asks what fills the other 70 percent, and the answer has to come from instruments that measure structure, function, and time.
Why a Single Draw Misses Trajectory
A panel is a photograph. Physiology is a film. Between any two healthy-looking frames, disease can be moving.
The canonical example is insulin resistance. Muscle can become progressively resistant to insulin years before fasting glucose or HbA1c cross diagnostic thresholds, because the pancreas quietly secretes more insulin to hold glycemia flat. Panels in those years read normal while the underlying system degrades, and the first abnormal A1c often arrives well after the process started.
This is where continuous and semi-continuous signals earn their keep. A CGM converts glucose from a twice-yearly point into a daily curve. Resting heart rate, HRV, sleep architecture, and respiratory rate from a ring or watch, plus home blood pressure taken properly (seated, rested, repeated), all generate slopes rather than points, and drift in a slope often precedes any flag. Home blood pressure is the clearest case where the cheap signal is also the strong one; averaged home readings tend to predict outcomes at least as well as single office measurements.
One caveat keeps this honest: wearables are trend sensors, not diagnostics. CGM devices are cleared and validated for diabetes management, while their accuracy and actionability in people without diabetes remain less established, a gap the CGM validation in nondiabetics literature documents directly. They belong between draws, not instead of them.
The Reference Range Problem
If you want reference ranges explained in one sentence: they typically bracket the middle 95 percent of results from a reference population, a pool that includes plenty of people with developing disease. How reference intervals are derived matters as much as the chemistry itself, because "normal" places you within a mixed population rather than certifying you as safe. Normal blood work but still at risk is the default state, not an anomaly.
Consider what that means in practice. An LDL-C of 110 mg/dL can sit comfortably inside the interval while being far too high for someone with a family history of early heart attacks. A TSH of 4.0 mIU/L is officially normal while producing symptoms in some people. A ferritin drifting from 110 to 40 over three years stays green on every report while telling a story of slow iron loss that any single result hides.
The mirror-image trap is "optimal range" marketing, thresholds invented to sell retesting panels, where the evidence is often weaker than the confidence. The defensible middle path is personal baselining. Establish your values across two or three draws, ideally fasted, at the same lab, in the same season, then read deltas. A fast, consistent within-range change can matter more than a single out-of-range flag, and it is invisible to the PDF.
Five Domains Blood Work Cannot See

Understanding what a comprehensive blood panel misses starts with the domains where plasma is structurally silent, and they include the leading causes of death. This table is the honest list of what blood tests can't detect, paired with the test that fills each gap.
| Domain | Why plasma is blind here | Fill-in test | Typical cadence |
|---|---|---|---|
| Coronary structure | lipids show risk factors, not plaque | coronary calcium score | once in a midlife window |
| Function under load | capacity appears only when stressed | VO2max test | every 1 to 3 years |
| Bone and body composition | density and lean mass never enter plasma | DEXA | baseline, then per risk |
| Clonal mutation | counts can be normal while clones expand | CHIP sequencing | once, age or count triggered |
| Cognition | no marker in any standard panel | structured cognitive baseline | midlife, repeat later |
Coronary calcium score vs lipid panel. ApoB predicts risk at the population level. A CAC scan measures the disease itself, calcified plaque in the artery wall. A zero score carries strong near-term reassurance, while a high score in a midlife adult reclassifies risk and typically intensifies prevention, sometimes decisively. Blood and the scan answer different questions, driver versus accumulated damage.
VO2max as a predictor of mortality. In a large Cleveland Clinic cohort, higher cardiorespiratory fitness tracked with lower all-cause mortality across the entire measured spectrum, with no observed ceiling where added fitness stopped helping. Fitness is function under load, and no chemistry panel prices it.
DEXA. Bone density and lean mass, the tissues that decide fracture and frailty risk in old age, are invisible to blood. Screening cadence follows guidelines, covered below.
Clonal hematopoiesis. Somatic mutations in blood stem cells can expand into dominant clones over decades. In the original sequencing survey, clonal hematopoiesis appeared in roughly 10 percent of people older than 65 despite unremarkable routine counts, and it carried an elevated risk of blood cancers and death, with later work linking it to cardiovascular risk as well.
Cognitive baseline. Late-life decline is judged against a norm. Establish a structured baseline in midlife and later change becomes a measurable delta instead of a family impression.
Note the exposure gap too: lead, PFAS, and similar toxins require targeted assays no standard panel includes. The tests beyond blood work for longevity are not more blood tests, and we cover several (FIB-4, clonal hematopoiesis, biological age) in dedicated pieces that work as chapters of this same system.
The Layered Testing Protocol

The ordering rule is information gained per decision changed. In practice, that sorts into four tiers.
Tier 0, the annual anchor
A comprehensive blood panel yearly, fasted, at the same lab, in the same season: metabolic, lipid with apoB, hepatic, renal, endocrine, hematologic, plus hsCRP. Build a personal baseline over two or three draws, then read year-over-year deltas alongside any medication or symptom change. This also answers how often to retest blood markers: yearly for the anchor, more often only when something you did changed.
Tier 1, continuous cheap signals
Health monitoring wearables (resting heart rate, HRV, sleep, respiratory rate), home blood pressure on a schedule, and a few weeks of CGM per year if glucose is your focus. They run between draws, catch drift early, and cost little per data point. They diagnose nothing, and they do not replace the anchor.
Tier 2, once per lifetime and guideline screens
Lp(a) once, because it is largely genetically determined and stable across life; measure it, calibrate prevention intensity, never pay to repeat it. ApoE status only after genetic counseling and only if the result would change your behavior. Guideline-scheduled advanced health screening tests live here too: coronary calcium scoring in midlife when the statin decision is genuinely borderline, DEXA per the USPSTF osteoporosis screening recommendation (women 65 and older, plus postmenopausal women under 65 with risk factors, with insufficient evidence to screen men), colorectal cancer screening from age 45, and low-dose CT for eligible current and former heavy smokers.
Tier 3, selective advanced testing
Longevity testing marketing concentrates here, so gate it hard. CHIP sequencing when age (roughly 60-plus) or unexplained cytopenias justify it. Multi-cancer early detection blood tests are the seductive newcomer, but their mortality benefit is not yet established, and a positive signal with no clear origin starts a diagnostic odyssey. Buy them inside clinical trials if you buy them at all.
Guardrails against over-testing
More sensing is not free. False positives cascade: a borderline PSA leads to biopsies, an incidental thyroid nodule leads to more imaging, and most of it resolves into nothing while consuming months of attention and real money. Incidental findings on sensitive whole-body imaging are common and usually benign, which is exactly why screening asymptomatic people with whole-body MRI remains contested. Quality also varies at the source: most direct-to-consumer panels are lab-developed tests, a category that has historically operated under CLIA laboratory rules rather than routine FDA device review, per the FDA's laboratory developed test overview. Cheap markers with no action attached are noise. Sensitive imaging without symptoms is a cascade generator.
Your Annual Sensing Calendar
| Cadence | What to run | What it buys you |
|---|---|---|
| Continuous | wearable RHR, HRV, sleep; weekly home BP log | slopes and drift detection |
| A few weeks yearly | CGM if glucose-focused | postprandial patterns |
| Annually | comprehensive blood panel, fasted, same lab | anchor plus personal deltas |
| Once per lifetime | Lp(a); ApoE with counseling | stable values, no retests |
| Age- and risk-gated | CAC midlife, DEXA at 65 or with risk, colonoscopy from 45, lung CT for eligible smokers, CHIP if triggered, cognitive baseline in midlife | structure, function, clonal coverage |
The decision rule that governs all of it:
Run a test only when a believable result would change what you do.
Both directions bind. A test you would ignore is cost and anxiety with no yield, and a test whose result changes nothing you do is a ritual. Attia's 25 to 30 percent was never really a measurement; it is a statement about the detection envelope of one instrument. Layer the annual anchor, the continuous signals, the once-per-lifetime markers, and the age-gated imaging, and your coverage climbs well past anything a single panel, however comprehensive, can deliver.
Stay in the loop.
Get the latest posts and exclusive content delivered to your inbox.
Join 50 readers. No spam. Unsubscribe in one click, anytime.
About the author
Elena Park
Sleep and Recovery Specialist
Elena has spent a decade helping people fix their sleep and recover faster, pairing wearable and HRV data with the cold, heat, and breathwork protocols she tests on herself first. She writes recovery routines that hold up under real, busy lives.
Related Posts

Did Rentosertib Reverse Aging or Just Treat Fibrosis?
Rentosertib lowered proteomic age in a phase 2 IPF trial, but the clock may be reading fibrosis. Learn how to grade drugs claiming to reverse aging.

Wearable Health Monitoring Protocol to Catch Disease Early
A wearable health monitoring protocol built on your own baseline, with deviation rules for RHR, HRV, respiratory rate, and skin temp, plus when to act.
Biological Age Testing, What Your Results Actually Predict
Biological age testing measures physiological wear, but pace of aging clocks often disagree. Learn what your results predict and how to change them.