Strength Standards by Age and Bodyweight for the Big Three
Compare your deadlift, squat, and bench against strength standards by age and bodyweight, then follow the programming plan your percentile band calls for.
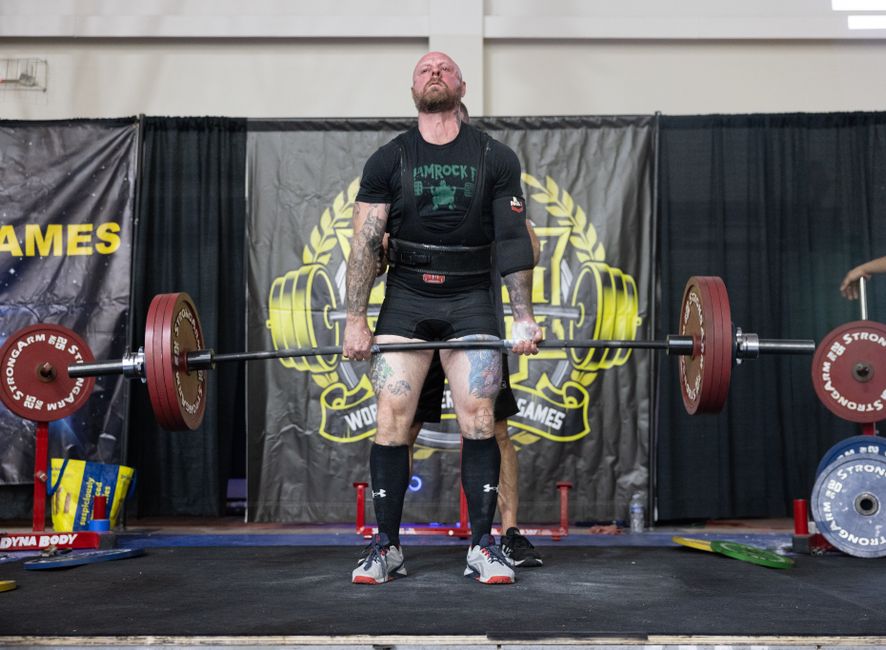
When Tommy Fury pulled 240 kg for the cameras, the coverage that followed filed the lift somewhere near the top one percent of humanity. The kilos are real, but the percentile label is doing unearned work. A raw barbell number means almost nothing until you attach two normalizers, bodyweight and age, and strength standards are the machinery for doing exactly that. Run 240 kg through that machinery and it becomes a percentile. Run your own deadlift, squat, and bench through it and you get something better than bragging rights, because the band you land in carries real information about fall risk, disease risk, and how long you are likely to stay capable. This piece runs the full chain: where the tables come from, where your big three probably rank, what that ranking plausibly predicts, and the training block each band actually calls for.
Stay in the loop.
Get the latest posts and exclusive content delivered to your inbox.
Join 44 readers. No spam. Unsubscribe in one click, anytime.
What a 240 kg deadlift actually proves
Fury reportedly walks around near the 100 kg mark. Somewhere between 95 and 110 kg of bodyweight, 240 kg works out to 2.2 to 2.5 times bodyweight, and that is the number that matters. For a sub-30 male, that range sits advanced-to-elite on age and bodyweight adjusted tables. It is genuinely strong, and no amount of cynicism about celebrity fitness content changes the arithmetic.
The pull is a clean illustration of the gap between absolute and relative strength. Absolute strength is kilos on the bar. Relative strength is kilos divided by bodyweight, and it is the fair currency whenever two lifters differ in size. A 60 kg lifter pulling 180 kg is 60 kg "weaker" than Fury in absolute terms and stronger in every normalized sense at 3.0 times bodyweight. The same logic ranks you against yourself across a cut or a bulk.
Readers ask a related question constantly, what percentile is a 2x bodyweight deadlift. For a healthy man under 40, doubling your bodyweight off the floor usually reads as a solid intermediate result on gym-log tables, around the middle of the pack among people who log their training and vastly higher against adults who never touch a barbell. Whether Fury's top-one-percent label survives depends entirely on which population you grade him against, a question worth holding until the end.
Where strength standards come from
Published standards are not one dataset. They are three different families, and they disagree for defensible reasons.
Crowdsourced gym logs. Sites like StrengthLevel aggregate millions of user-entered lifts into percentile curves by exercise, bodyweight, sex, and age. The sample is huge and current, but it self-selects for people motivated enough to log workouts, and it mixes tested maxes with estimates. Their deadlift strength standards tables are the friendliest starting point for a recreational lifter precisely because the reference population is recreational.
Performance tables. The ExRx tradition publishes strength standards by bodyweight class, derived from trained populations and older strength research. These skew toward prepared lifters, so the intermediate-and-up bands read harder than the gym-log equivalents.
Competition data. Drug-tested meet databases such as OpenPowerlifting and IPF results capture specialists under standardized conditions, paused bench press, judged depth, commands, no hitching. Percentiles here are the harshest you will find, because everyone in the pool trained to compete. Comparisons across bodyweights use DOTS, a coefficient that divides your total by a bodyweight curve, and a DOTS calculator does that math in seconds.
The same lifter can rank 80th percentile on a gym-log table and 45th against meet data, and both numbers are correct.
Honest benchmarking means checking your lift against more than one population before deciding what it means. Age adjustment comes on top of all this as a discount per decade past your peak window, covered below.
The big three standards by age and bodyweight
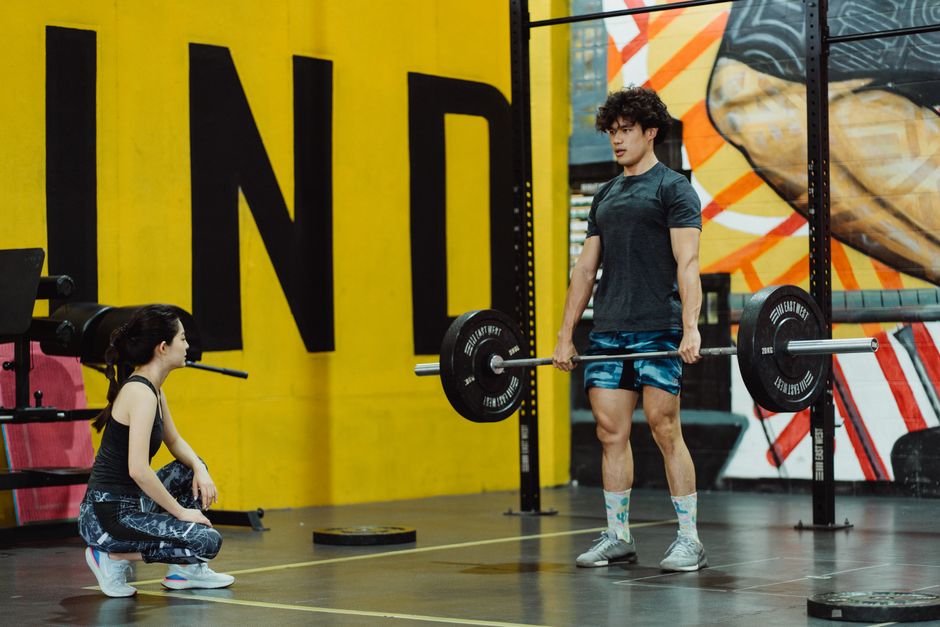
"How much should I deadlift for my age and weight" has no single answer, because there is no one average deadlift by bodyweight and age, only bands that shift by source. The table below consolidates the common ground across the datasets into bodyweight multiples for men. Bodyweight strength standards work this way on purpose, expressing every band as a fraction of what you weigh, and the squat and bench press standards follow the same band logic.
| Band | Deadlift | Squat | Bench press |
|---|---|---|---|
| Untrained | 0.75 to 1.0x | 0.5 to 0.75x | 0.4 to 0.6x |
| Novice | 1.25 to 1.5x | 1.0 to 1.25x | 0.75 to 0.9x |
| Intermediate | 1.75 to 2.0x | 1.4 to 1.6x | 1.0 to 1.2x |
| Advanced | 2.25 to 2.5x | 1.9 to 2.1x | 1.4 to 1.5x |
| Elite | 2.75x and up | 2.3x and up | 1.7x and up |
Two anchors keep this honest. A deadlift equal to bodyweight lands at roughly novice level for men, and the advanced band opens around 2 to 2.5 times bodyweight. Women's absolute loads at equivalent relative standing run lower, commonly around 60 to 70 percent of male numbers, with the gap widest on bench and narrowest on the deadlift.
Worked example: an 80 kg male at age 40 sits essentially in his peak window, so the age discount is close to zero. His intermediate band is roughly a 140 to 160 kg deadlift, a 112 to 128 kg squat, and an 80 to 96 kg bench. Advanced is roughly 180 to 200, 152 to 168, and 112 to 120 respectively. For exact kilogram values at your bodyweight rather than multiples, plug your numbers into a bodyweight standards calculator built on the performance tables.
How much strength you lose each decade
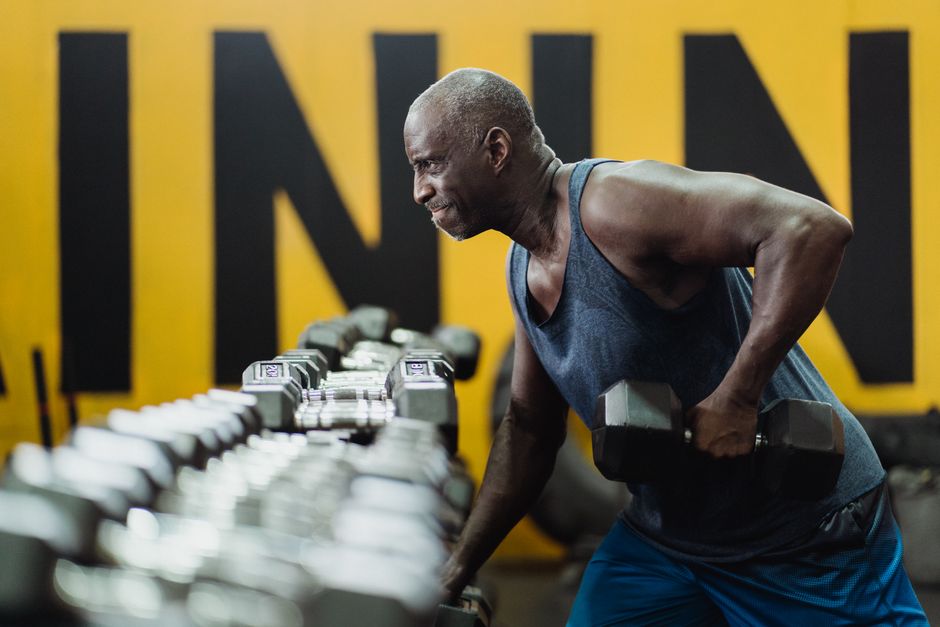
Strength decline with age follows a curve you can plan around, and the useful number is a rate. In untrained adults, strength loss typically runs on the order of 1 to 1.5 percent per year after roughly age 50, and it compounds quietly.
| Age | Typical share of lifetime peak |
|---|---|
| 35 to 44 | 100 percent, the peak window |
| 45 to 54 | 90 to 95 percent |
| 55 to 64 | 80 to 88 percent |
| 65 to 74 | 70 to 80 percent |
| 75 and up | 55 to 70 percent |
Two details matter more than the table. First, power declines faster than maximal strength, and power is what catches a stumble and drives a staircase. Second, trained lifters deviate from this curve sharply, because much of what reads as aging is disuse, and the NSCA position statement on resistance training for older adults makes the case that consistent loading preserves a large share of function. That is all age adjusted strength standards really are, the bodyweight table above multiplied by a survival curve.
For men over 40 reading strength standards, apply the discount from this table instead of pretending the 25-year-old version of you sets the reference. A 55-year-old pulling 1.8 times bodyweight grades meaningfully higher against his own age group than the raw table suggests.
Why your one-rep max is a healthspan marker
Does grip strength predict lifespan? The honest answer is that it predicts, strongly and in a dose-response way, without letting anyone promise you extra years. The landmark evidence is the PURE study, published in The Lancet, which measured grip strength in roughly 140,000 adults across 17 countries. Each 5 kg drop in grip came with a reported hazard ratio around 1.16 for all-cause mortality, about 16 percent higher risk, plus graded associations with cardiovascular death.
A hand grip is not a deadlift, but it is the same construct measured cheaply, and the grip strength and mortality literature points the same direction as the barbell data. Meta-analyses of cohort studies have associated higher muscular strength with lower all-cause mortality even after statistical adjustment for muscle mass and cardiorespiratory fitness. Read that carefully: size and fitness do not absorb the effect. Performance carries a signal of its own.
Clinical medicine has noticed. The 2019 EWGSOP2 consensus on sarcopenia uses low grip strength, below roughly 27 kg for men and 16 kg for women, as a primary diagnostic criterion, which puts a strength test inside standard geriatric practice. If you want to see where your own grip sits across the adult life course, the grip strength normative data from Dodds and colleagues charts percentiles by age and sex.
The chain runs like this. Your big-three percentile is a proxy for whole-body neuromuscular performance, the same construct a dynamometer samples in a clinic. Strong associations are not destiny, but they are directional information, and the direction favors people who lift.
Reading your band without fooling yourself
Most self-assessments fail in predictable ways, and almost all of them inflate the result.
- Tested versus estimated maxes. Formulas like Epley convert a rep max into a projected single. Research on 1RM prediction formulas finds low-rep estimates track tested maxes reasonably closely, but accuracy drifts as rep counts climb. A clean 3 to 5 rep set is trustworthy input for band placement. A 12-rep grinder extrapolated upward is a work of fiction.
- Range and standard of comparison. Partial squats, touch-and-go bench counted as paused, straps on one lift and bare hands on the other, raw compared with geared, gym PRs compared against meet conditions. Each of these can move your apparent band by a full tier.
- Weight classes. Comparing your 140 kg pull at 90 kg bodyweight against a friend's 160 kg at 120 kg bodyweight is meaningless without normalization. Use bodyweight multiples or DOTS, never raw kilos.
Retest on a cadence that matches adaptation: quarterly rep-max tests on each lift, true singles at most once or twice a year, and only when the rest of your programming has earned them. Your percentile is a trend line, and quarterly sampling is frequent enough to see the trend without living in test mode.
The programming response for your band
Ambition is not a program. A training program based on your strength level is one matched to the band your numbers earned, and this is the decision layer most articles skip.
| Band | Main job | What the block looks like |
|---|---|---|
| Below novice | Groove and consistency | Full-body three sessions a week, three sets of five per lift, small linear jumps each session |
| Novice | Build a volume base | Three to four working sets of five to eight, weekly load increases, one variation per lift |
| Intermediate | Organize fatigue | Four-week waves or weekly undulation, paused and tempo variations, autoregulated top sets |
| Advanced | Protect and express | Maintenance loads near 80 to 90 percent of your best, added speed and power work, scheduled deloads |
Below novice, the bottleneck is skill and consistency, not stimulus, and simple progressive overload fixes more than any exotic scheme. Novices should chase volume across the basic lifts while linear gains are still cheap. Intermediates need periodization and variations, because monotone loading stops working somewhere in this band and autoregulation starts earning its keep. Advanced lifters optimizing for longevity get more return from maintenance loads, power work, and recovery capacity than from heavier singles, since the marginal PR costs more tissue and recovery currency than it buys in health outcome.
The fine print for men over 40: treat recovery as a training variable, extend warm-ups, prefer variations that spare the joints you have already spent, and respect the detraining curve, which bites faster than the gaining curve ever rewarded you.
What these numbers cannot tell you
Every dataset here carries bias worth naming. Gym logs self-select for enthusiasts and include untested, estimated, and occasionally fictional lifts. Meet data is clean but specialized, so it says little about the general population. The tables assume average leverages, ignore injury history, and thin out badly for women and for lifters past 65. None of them know whether you are a climber, a rower, or a farmer with a grip that embarrasses your bench.
So, the verdict on Fury. A 240 kg pull from a sub-30 male near 100 kg is a legitimate advanced-to-elite result at roughly 2.2 to 2.5 times bodyweight, and calling it top-one-percent strength is trivially true against the whole adult population, most of whom never train, while unremarkable against prepared powerlifters. Both claims can be honest at once. That is the entire lesson of adjusted standards.
The one-paragraph protocol: pick two tables from different dataset families, divide each lift by your bodyweight, apply the age discount from the decline table, and place your band using a clean 3 to 5 rep set rather than an extrapolated rep fest. Treat the resulting percentile as a healthspan marker, not an identity. Retest quarterly. Run the block your band calls for, and re-read the tables when the band changes.
Stay in the loop.
Get the latest posts and exclusive content delivered to your inbox.
Join 44 readers. No spam. Unsubscribe in one click, anytime.
About the author
Jordan Reyes
Registered Dietitian
Jordan ditched diet dogma for metabolic health, running continuous glucose monitors and food journals to see what actually moves the needle. He writes nutrition and supplement protocols grounded in evidence, not influencer trends.
Related Posts
Sarcopenia Prevention After 50 Is Partly Timing
Sarcopenia prevention needs a third lever beyond lifting and protein. Time light, meals, and training to your muscle clock to defend strength after 50.
Can Exercise Reverse Muscle Aging? What Training Cannot Fix
Can exercise reverse muscle aging? Training normalizes over half the molecular signature of aging muscle, but inflammaging and stem cell loss persist.

Isometric Training Benefits for Tendons and Blood Pressure
Isometric training benefits extend past strength. Static holds rebuild tendons and lower resting blood pressure with protocols you can start today.